
Reports & Dashboards
Your own reports and dashboards, built from the data already in the Portal.
15 features in 4 groups. Included in Starter, Business, Professional, Enterprise and Business (founding rate)
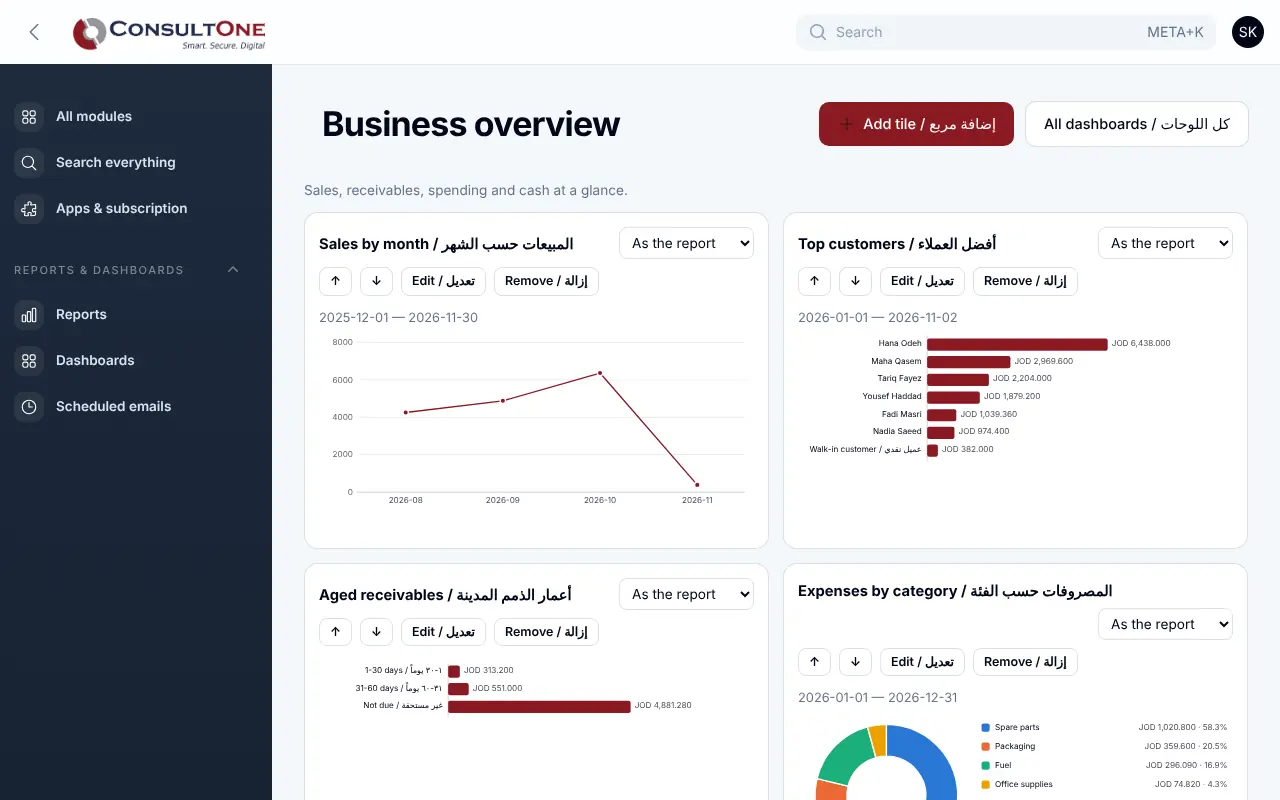
Every report means an export, a spreadsheet and an afternoon, and the numbers are old by the time they are shared.
With Reports & Dashboards
Pick the data, the totals and the period, and see the answer as a table or a chart. Put reports side by side on dashboards, share them with the roles that need them and have them emailed on a schedule. Each person only ever sees the data their role allows.
Group 1 of 4, 6 features
Build a report
- Data from Finance, Inventory, CRM, HR and payroll, Projects and Helpdesk
- A list of rows, or totals grouped by up to three fields
- Sum, count, average, minimum, maximum and distinct count
- Dates grouped by day, week, month, quarter or year
- Conditions and periods such as this month, last quarter or year to date
- Amounts kept per currency, or in JOD at the rate each document was booked
Group 2 of 4, 4 features
See and share
- Live preview as a table, bar, line or pie chart, or a single number
- Export to CSV and Excel, or print and save as PDF
- Dashboards of report tiles on a grid, each tile with its own period
- Share a report or dashboard with roles in your company
Group 3 of 4, 3 features
Scheduled emails
- Daily, weekly or monthly emails with the report attached as CSV
- Recipients chosen from your company members
- A history of every send
Group 4 of 4, 2 features
Ready to use
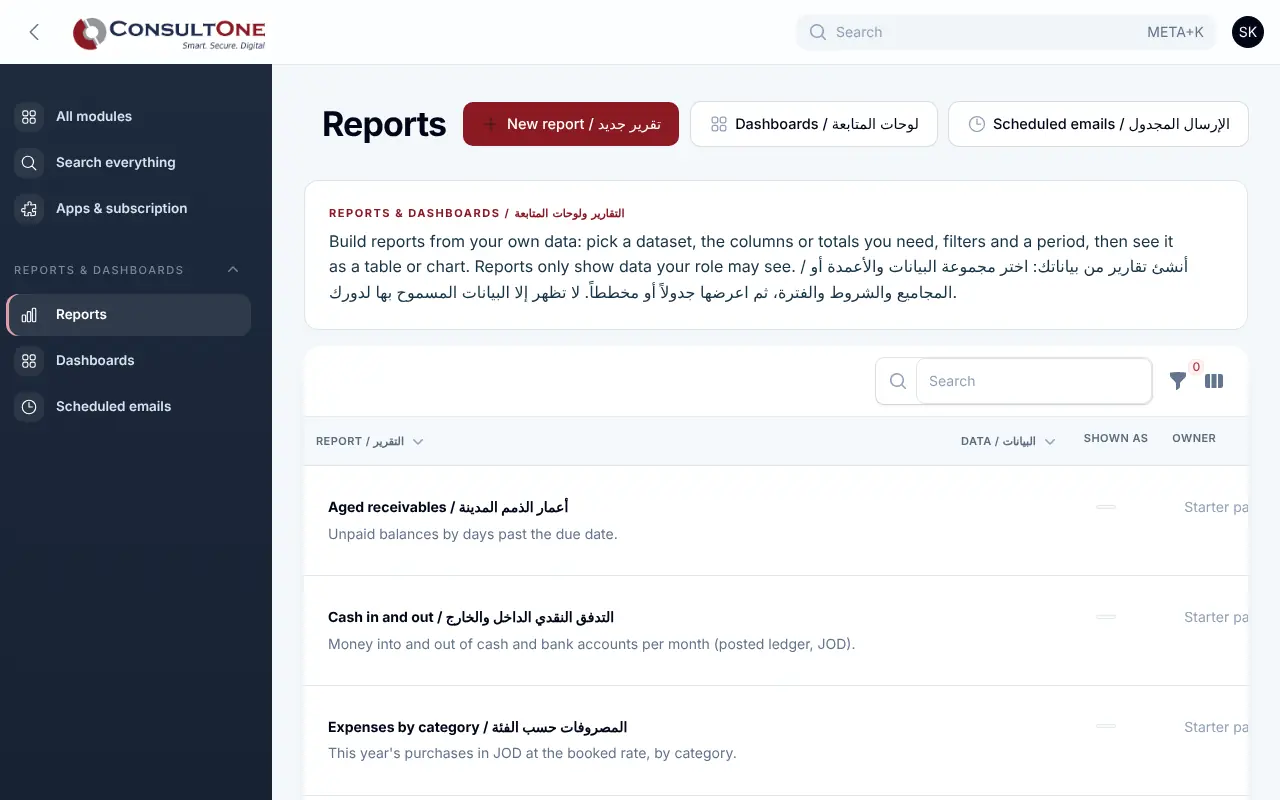
- 12 ready-made reports: sales by month, top customers, aged receivables, expenses by category, cash in and out, stock value, deals by stage, won deals, headcount and payroll cost, timesheet hours, tickets and SLA, overdue tasks
- Two ready-made dashboards: business overview and operations
How it works
- 1
Open a ready-made report
Start from the starter pack or a new report on any dataset.
- 2
Choose totals and a period
The preview updates as you change it.
- 3
Share or schedule it
Put it on a dashboard, share it with a role or email it every week.
Works with
Apps it connects with inside the Portal. Each has its own presentation.
- Finance & AccountingInvoicing to financial statements, built for Jordan and the Gulf.
- CRM & ContactsEvery customer conversation, deal and follow-up in one place.
- HR & PayrollEmployees, attendance, leave, claims and payroll for Jordan, the UAE and Saudi Arabia.
- Inventory, POS & StoreStock in every warehouse, a point-of-sale till and a pickup store, all on the same books.
- Projects & timesheetsPlan the work, log the hours and invoice the time.
- Helpdesk & Help CentreSupport tickets with targets, and a help centre that answers first.
Settings and security
Settings you control
- Sharing by role
- Email schedules and recipients
Your data stays your company's
- Every company has its own separate books that no other company can see.
- Two-step sign-in is required for owners and administrators.
- Access by role: owner, administrator, accountant, staff, read only.
Plans that include it
Plans that include this app are marked. Every self-service plan starts with a 14-day free trial.
Starter
Includes this app- Included apps
- Finance & Accounting
- E-invoicing
- Sales: quotes & orders
- CRM & Contacts
- HR & Payroll
- Customer portal
- Reports & Dashboards
- Up to 2 users
Business
Includes this app- Included apps
- Finance & Accounting
- E-invoicing
- Sales: quotes & orders
- CRM & Contacts
- HR & Payroll
- Inventory, POS & Store
- Projects & timesheets
- Helpdesk & Help Centre
- Appointments
- Document signing
- Customer portal
- Reports & Dashboards
- Up to 5 users
Professional
Includes this app- Included apps
- Finance & Accounting
- E-invoicing
- Sales: quotes & orders
- CRM & Contacts
- HR & Payroll
- Inventory, POS & Store
- Projects & timesheets
- Helpdesk & Help Centre
- Document signing
- Customer portal
- Reports & Dashboards
- Automation & API
- Up to 15 users
Enterprise
Includes this app- Included apps
- Finance & Accounting
- E-invoicing
- Sales: quotes & orders
- CRM & Contacts
- HR & Payroll
- Inventory, POS & Store
- Projects & timesheets
- Helpdesk & Help Centre
- Appointments
- Document signing
- Customer portal
- Reports & Dashboards
- Automation & API
- User allowance by agreement
Business (founding rate)
Includes this app- Included apps
- Finance & Accounting
- E-invoicing
- Sales: quotes & orders
- CRM & Contacts
- HR & Payroll
- Inventory, POS & Store
- Projects & timesheets
- Helpdesk & Help Centre
- Customer portal
- Reports & Dashboards
- Automation & API
- Up to 10 users
Prices in Jordanian dinars per month.
Questions before you start
Can staff see salaries in a report?
No. Payroll data is only for owners, administrators and HR officers; sharing a report never widens what a role may see.
Do I write formulas or SQL?
No. You choose fields, totals and conditions from lists.
Open your workspace today
14-day free trial, no card needed. Two-step sign-in is on from day one.